New MapD 3.2.2 Release Brings Geo Heatmap, Custom Aliases, Faster SQL Sorts and More
Try HeavyIQ Conversational Analytics on 400 million tweets
Download HEAVY.AI Free, a full-featured version available for use at no cost.
GET FREE LICENSE
Today we are pleased to announce the release of 3.2.2 version of MapD. This release brings some key capabilities and performance improvements to both our interactive visual analytics client, MapD Immerse, and our GPU-accelerated SQL engine, MapD Core.
New Geo Heatmap Chart Type

Average taxi fare in NYC across one million taxi rides
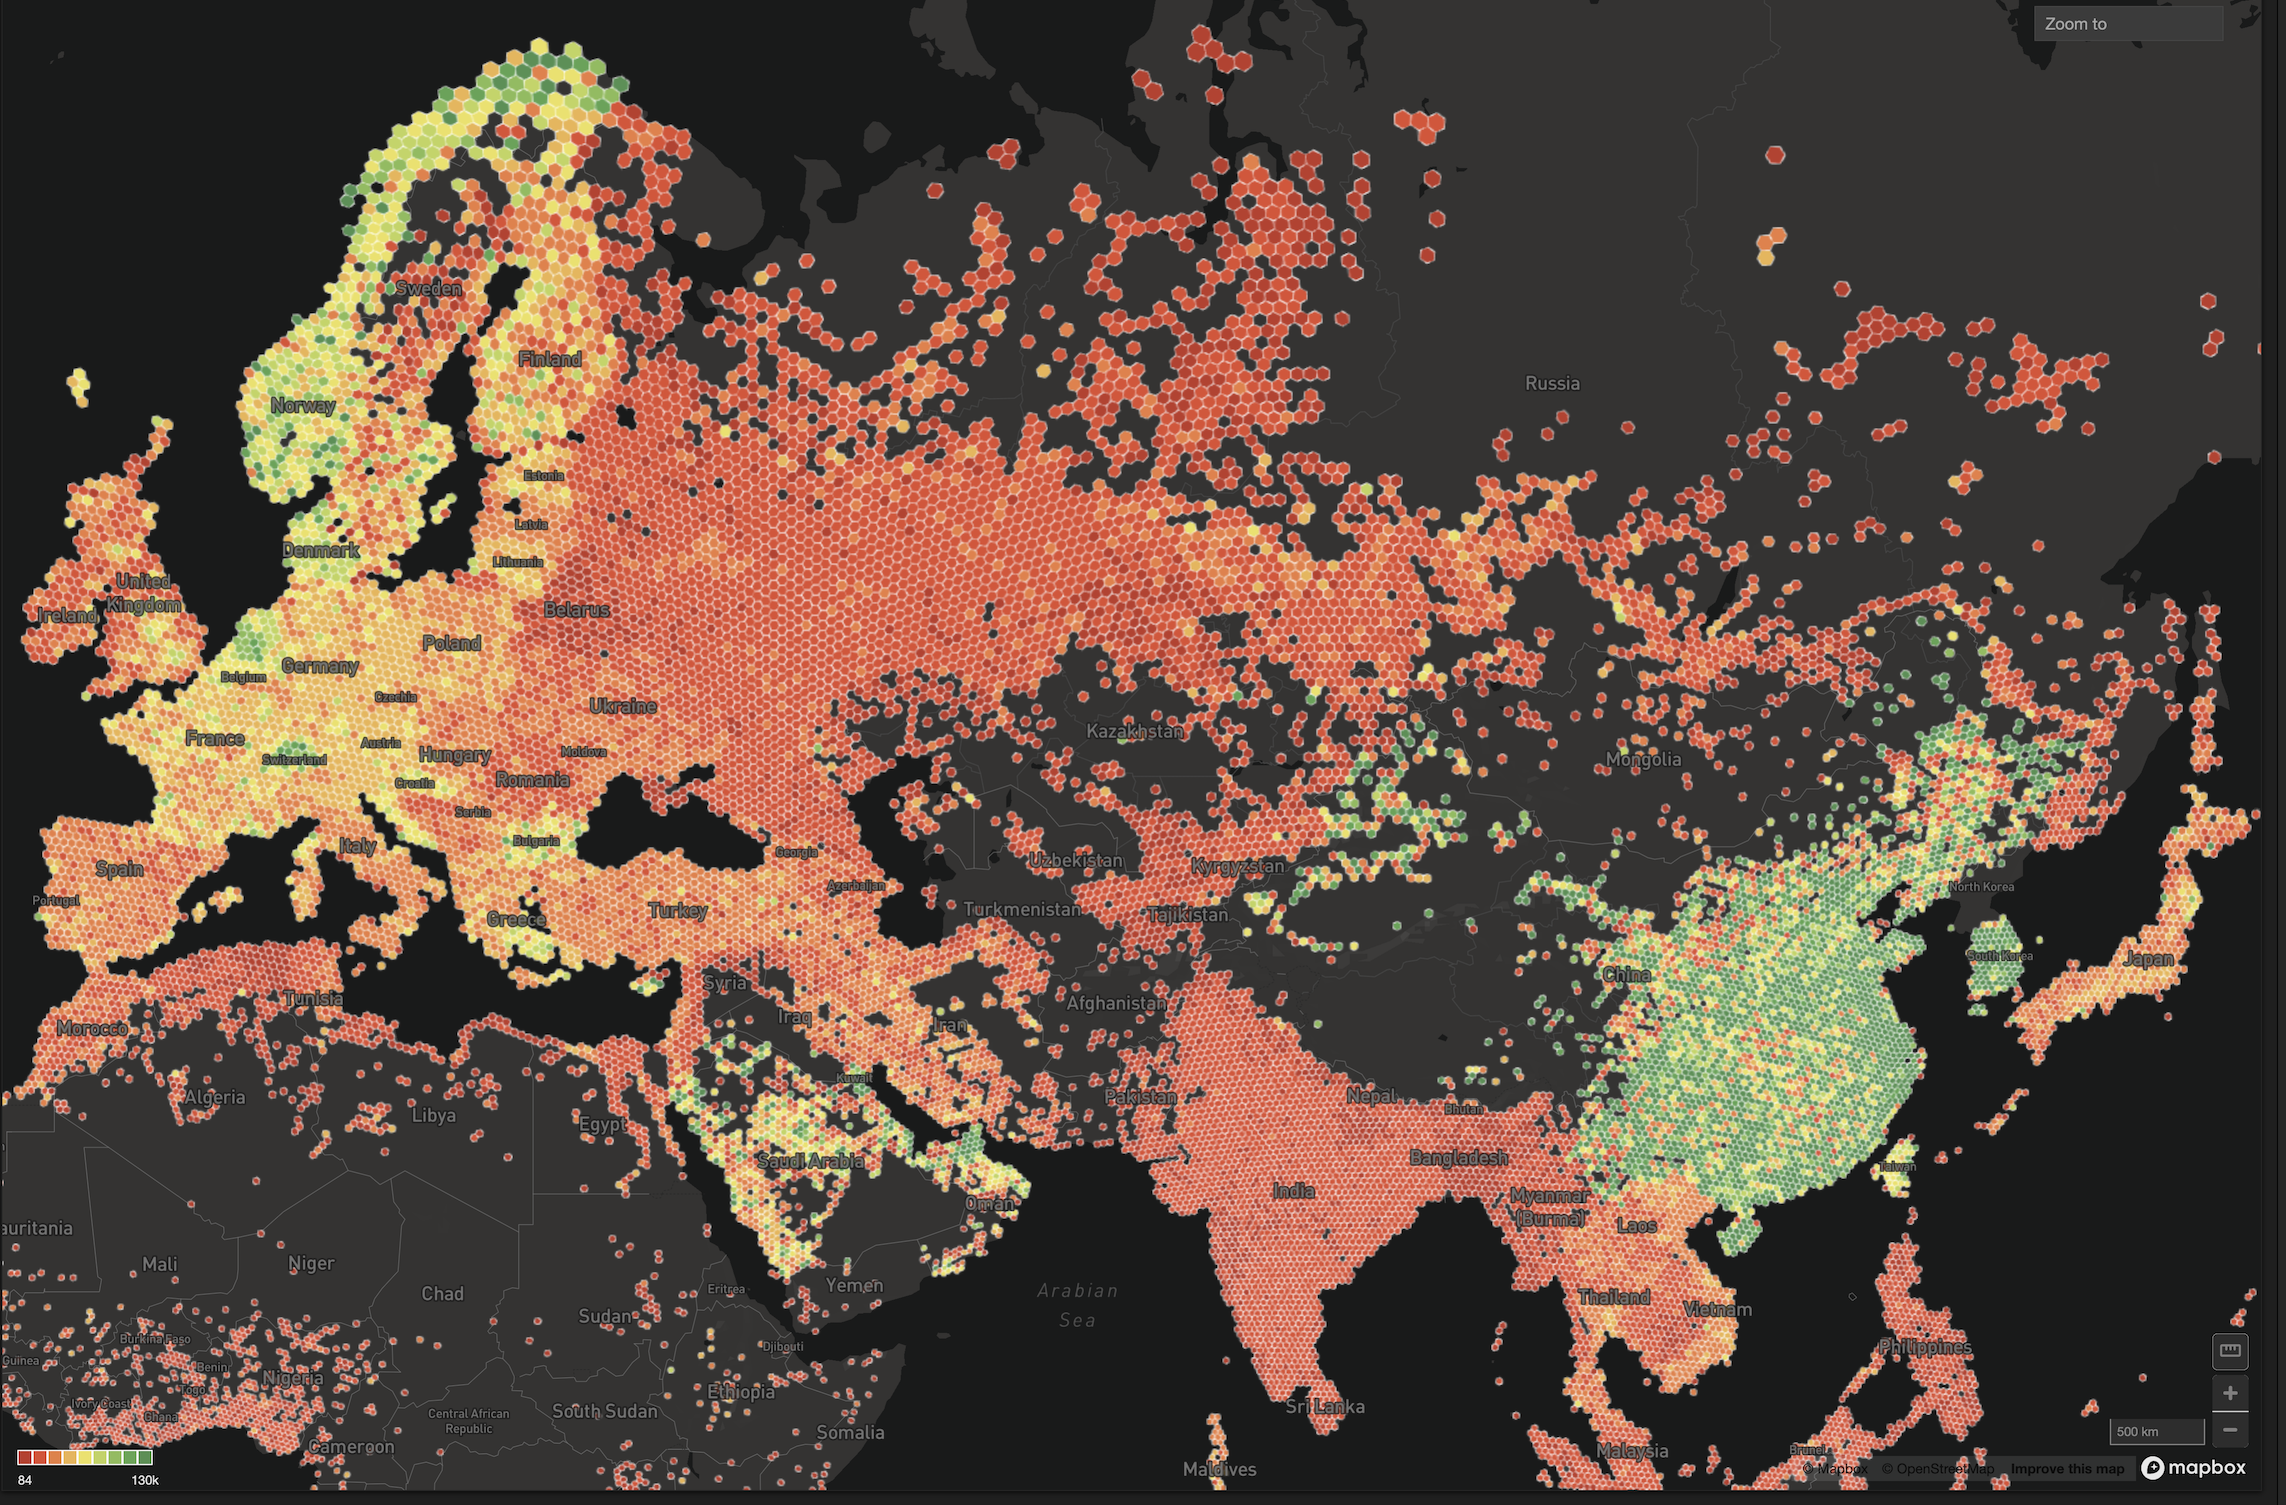
You can now create geo heatmaps to display density or clusters of activity over a geographical area. The heat map is like a choropleth map (also supported by MapD Immerse) but shows a change across a geographic landscape as a rasterized dataset-conforming to an arbitrary, but usually small, grid size (pixel bin size). Heat mapping is a way of geographically visualizing locations so that patterns of higher than average occurrence of things likes foot traffic, crime activity, store locations, or average taxi fare (in case of the chart above) can emerge.
We allow the user to specify either rectangular or hexagonal heatmap bins (the latter shown above). In a future release we plan to allow Gaussian smoothing between bins as well.
MapD Immerse makes geo heatmap analysis on millions of data points almost instantaneous. It is possible because MapD Core parallelizes the data processing to thousands of GPU cores and then passes the dataset to the OpenGL GPU-rendering library to generate the entire layer. See the documentation to learn more.
Alias for Custom Measures and Custom Dimensions
Aliases provide alternative business-friendly names for custom dimensions and custom measures. This capability will allow you to show labels that are more relevant to your users or your analysis. See the documentation to learn more.
You can name the custom SQL query (Quantity * Price) + (Quantity * Price * Tax) as Total.

Rename the Gender like ‘f’ custom dimension to Women Voters.
600

Text Widget
The Text Widget is a way for you to annotate your MapD charts. This rich editor supports descriptive text, code samples, and graphics to help you communicate more effectively. See the documentation to learn more.

New SQL Support and Performance Improvements
We have also added new SQL support and performance improvements in MapD Core.
- Support for joins on time and date
- Support for equi-joins between expressions and columns
- Performance improvement for non-grouped , projected top-k queries of form order by col limit n. We are using a GPU- heap algorithm to efficiently compute these top-k queries.
- Performance improvement for top-k queries on sharded tables. For users with multiple GPUs and/or multiple nodes, sharding on a high-cardinality GROUP BY key will now be much more performant as we avoid reducing the results between GPUs/nodes. In our testing we have seen significant speedup, reducing a sample query on 2B records with 80M groups execution time to 0.6 secs on a small 2 leaf (2 GPU per leaf) cluster.
Full details available in our release notes. Also, remember the MapD Platform is available to download so check out for yourself!


