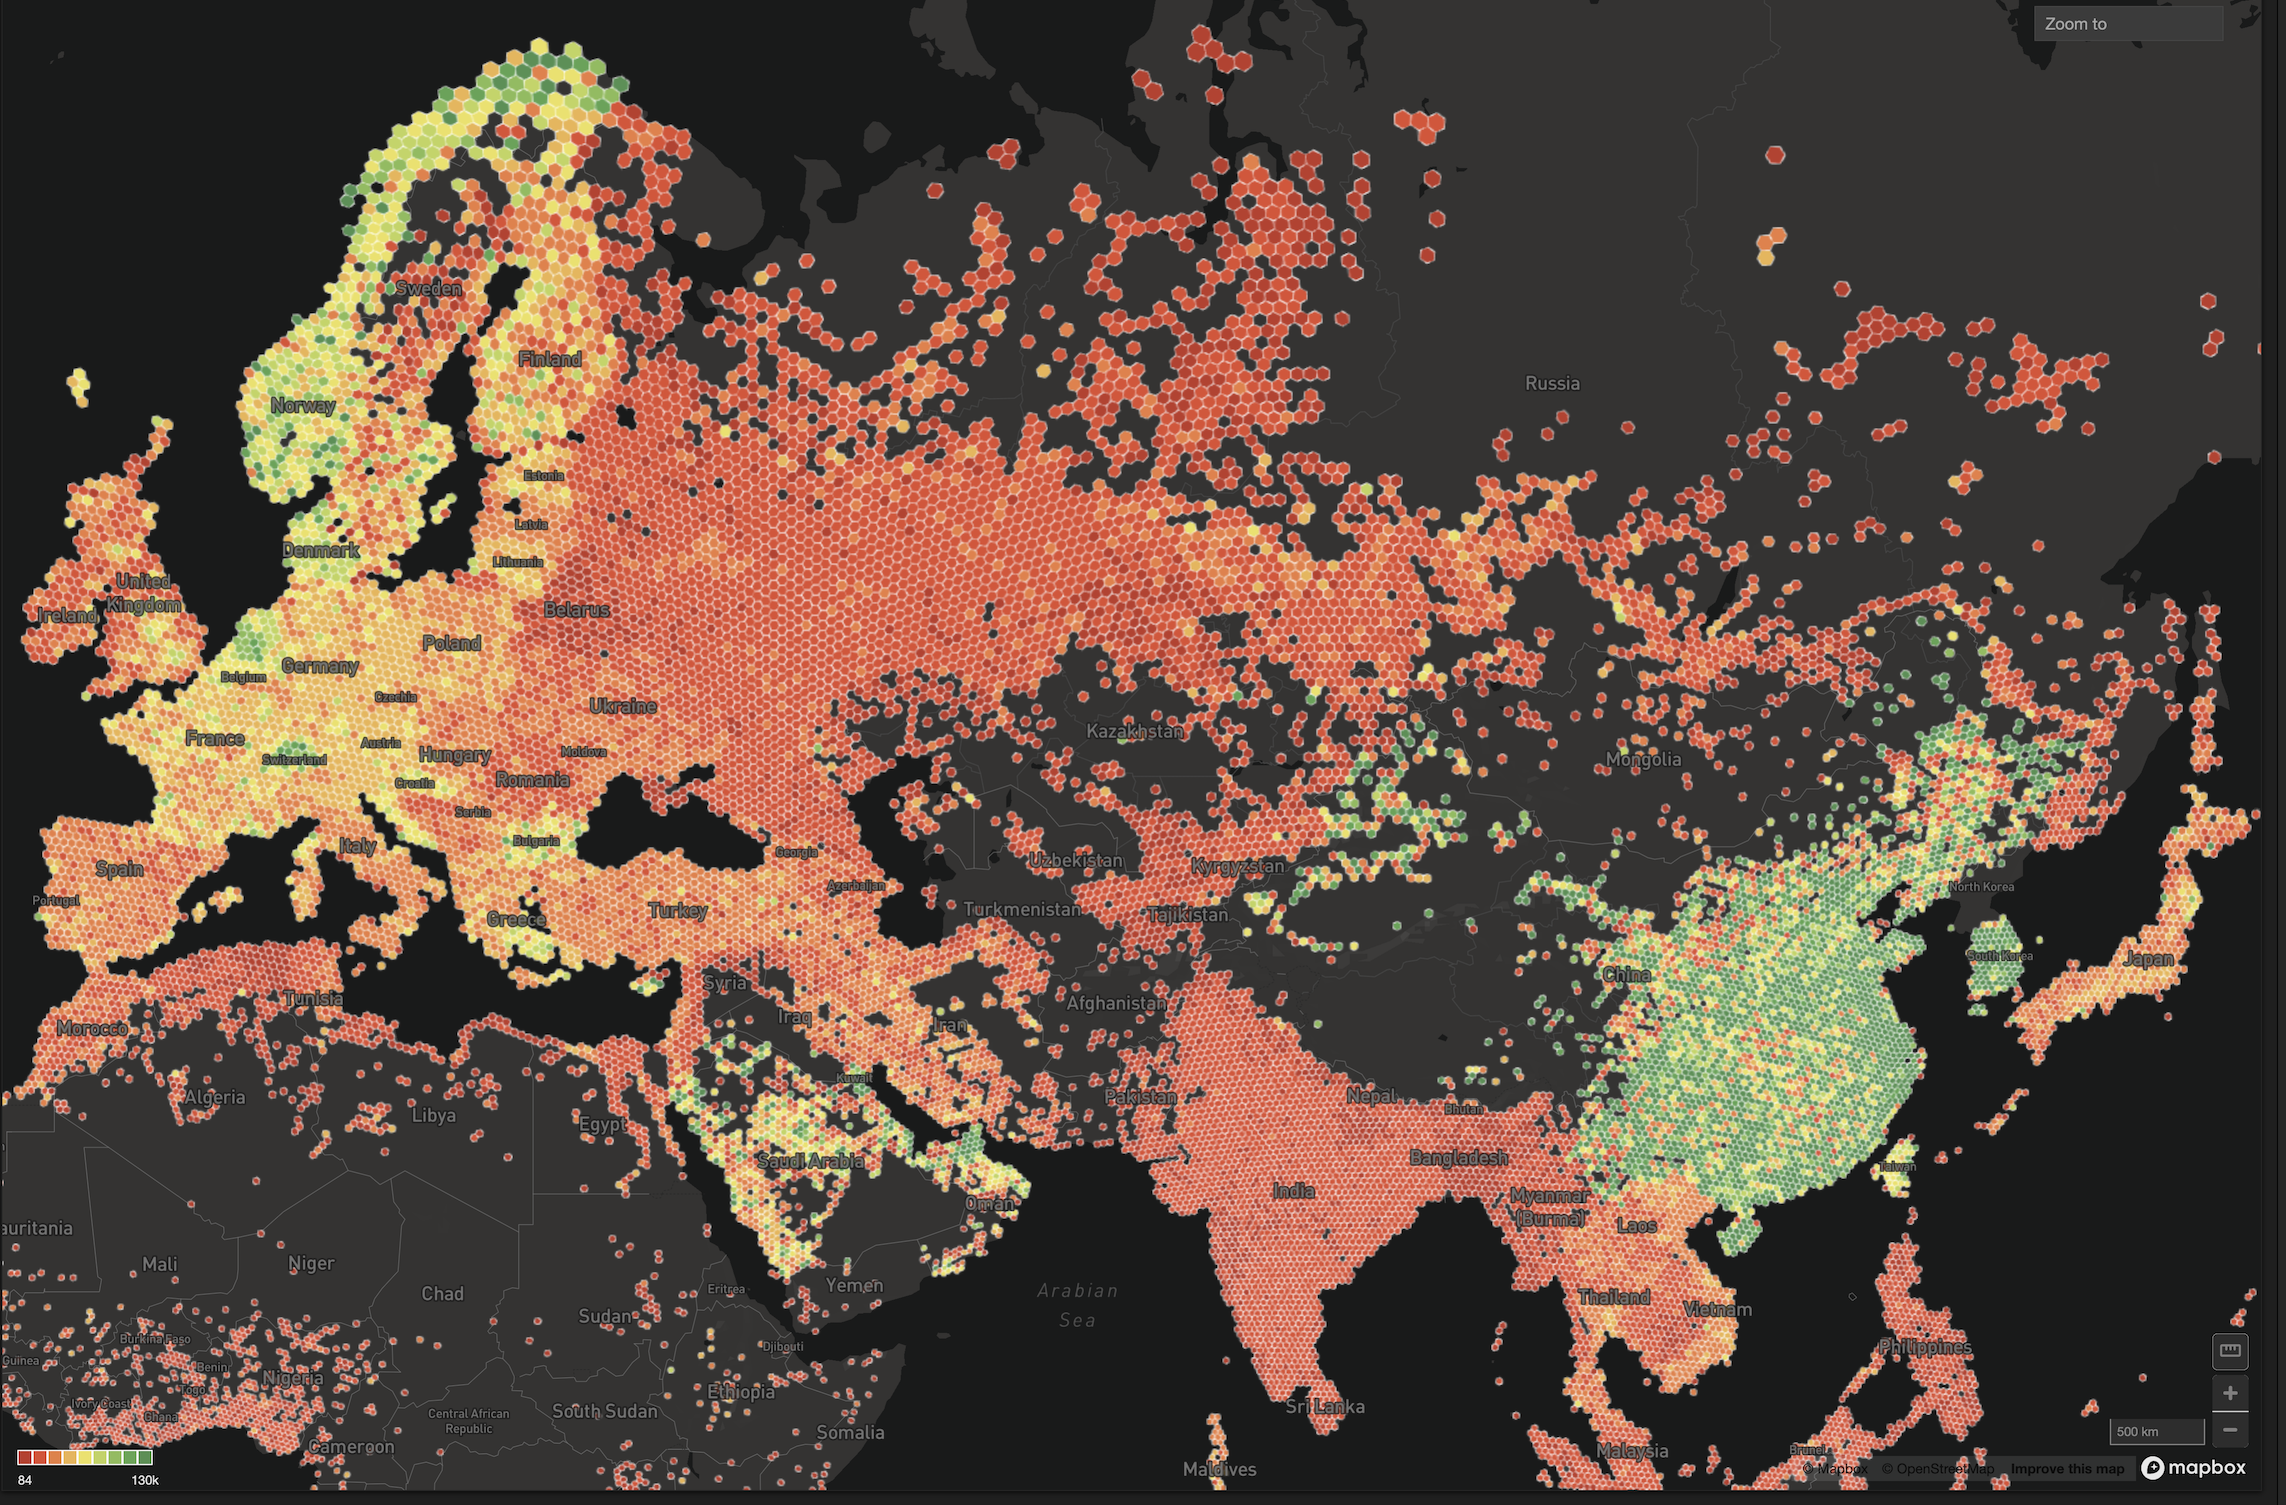
The Forest AND The Trees
Try HeavyIQ Conversational Analytics on 400 million tweets
Download HEAVY.AI Free, a full-featured version available for use at no cost.
GET FREE LICENSEOrganizations are visualizing and exploring data in ways we once only associated with science fiction films.

Analysts live a world with access to a plethora of data visualization and reporting tools. Long gone are the days of Excel charting as the primary means for visualizing data. As the toolkit has evolved, the amount of data we collect and analyze has exploded. Websites and phone apps track a user’s every click or swipe. IoT devices record the location of every vehicle in the fleet. Cell phones provide quality of service information with every connection to the network. Satellites capture parking lot and traffic data. Oil and gas wells give millions of readings per second.
Considering the vast amount of data businesses collect and limitations of CPU compute capacity, end users and business intelligence engineers are forced to design their reporting structures to only answer KNOWN questions. To achieve this, architects typically employ pre-aggregation or down-sampling techniques.
But what about the UNKNOWN questions which arise from data exploration?
- Where are the outlier transactions?
- Why is this chart skewed?
- Was the sample set truly representative of the full set?
Users typically take a prescribed path to further investigate anomalies:
- Writing SQL against the source databases (assuming access permissions)
- Submitting a ticket for engineering to make the data available
- Accepting technology as an impediment of intellectual curiosity
Each solution comes with a hidden cost:
- Lost analyst productivity
- Expensive engineering resource utilization
- Unknown business decision ramifications
Many companies think they are addressing these concerns with “self-service BI” and data democratization strategies, but in truth, they remain confined to the limitations of CPU-powered analytics. As a result, they haven’t moved the needle at all. It is simply old wine in new bottles.

Ultimately, any BI solution (self-service or otherwise) needs to deliver timely, straightforward access to both the 30,000 foot view and the proverbial single grain of sand (or record level).

For some smaller organizations this is possible. However, companies with large-scale data warehouses struggle to provide deep and wide access to data because they are still rooted in this CPU era. IT organizations that continue to select legacy CPU-based analytical systems are doing a disservice to their clients. There are arguments around complexity and elements of maturity in these systems that are not present in GPU-based solutions and continue to require CPU-powered solutions, despite their performance anxiety. Still, for a significant and growing set of mission critical workloads, existing systems are failing and demand the benefits of GPU compute.
MapD and Nvidia’s GPUs provide enterprises with a path forward to BI and visual analytics nirvana. To read more about our in-memory, relational, SQL compliant database, MapD Core click here. To read more about our visual analytics frontend, MapD Immerse, click here.
What data-driven decisions is your company failing to make due to current hardware and software choices?
If you want to see what's possible - check out our online demos.


