On Friday, Amazon announced the availability of large GPU instances on AWS marking a new chapter in the GPU revolution.

Speed is increasingly defining the user experience from B2C to B2B. No matter how attractive the application, if it does not perform from a speed perspective, it might as well be ugly because that is the sentiment increasingly attached to slow, plodding applications on the web, mobile and in the enterprise

Having made the improbable jump from the game console to the supercomputer, GPUs are now invading the datacenter. This movement is led by Google, Facebook, Amazon, Microsoft, Tesla, Baidu and others who have quietly but rapidly shifted their hardware philosophy over the past twelve months.

As we enter the final stretch of our summer, it is time to start looking ahead to the conference-rich third and fourth quarters. After a period of relative calm, we are back with a vengeance, starting almost immediately.

In the dataworld, there is a particular dataset, referred to as “the taxi dataset,” that has been getting a disproportionate amount of attention lately.

Who would have thought that analytics would become the bottleneck in the modern organization?

There is little question that the GPU age is upon us. We see it everywhere, from game consoles to supercomputers and now the datacenter, GPUs are permeating more and more of the computing ecosystem.

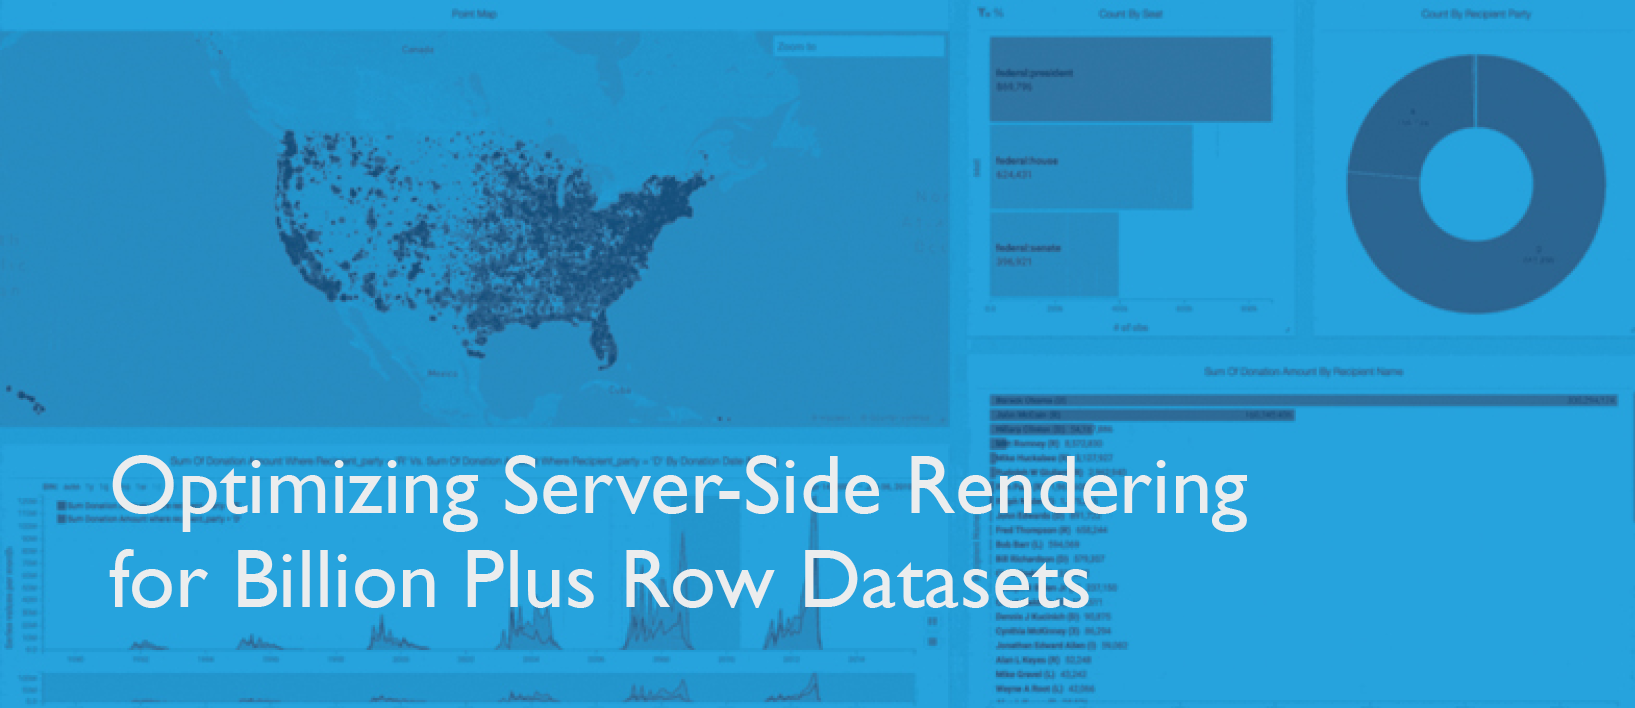
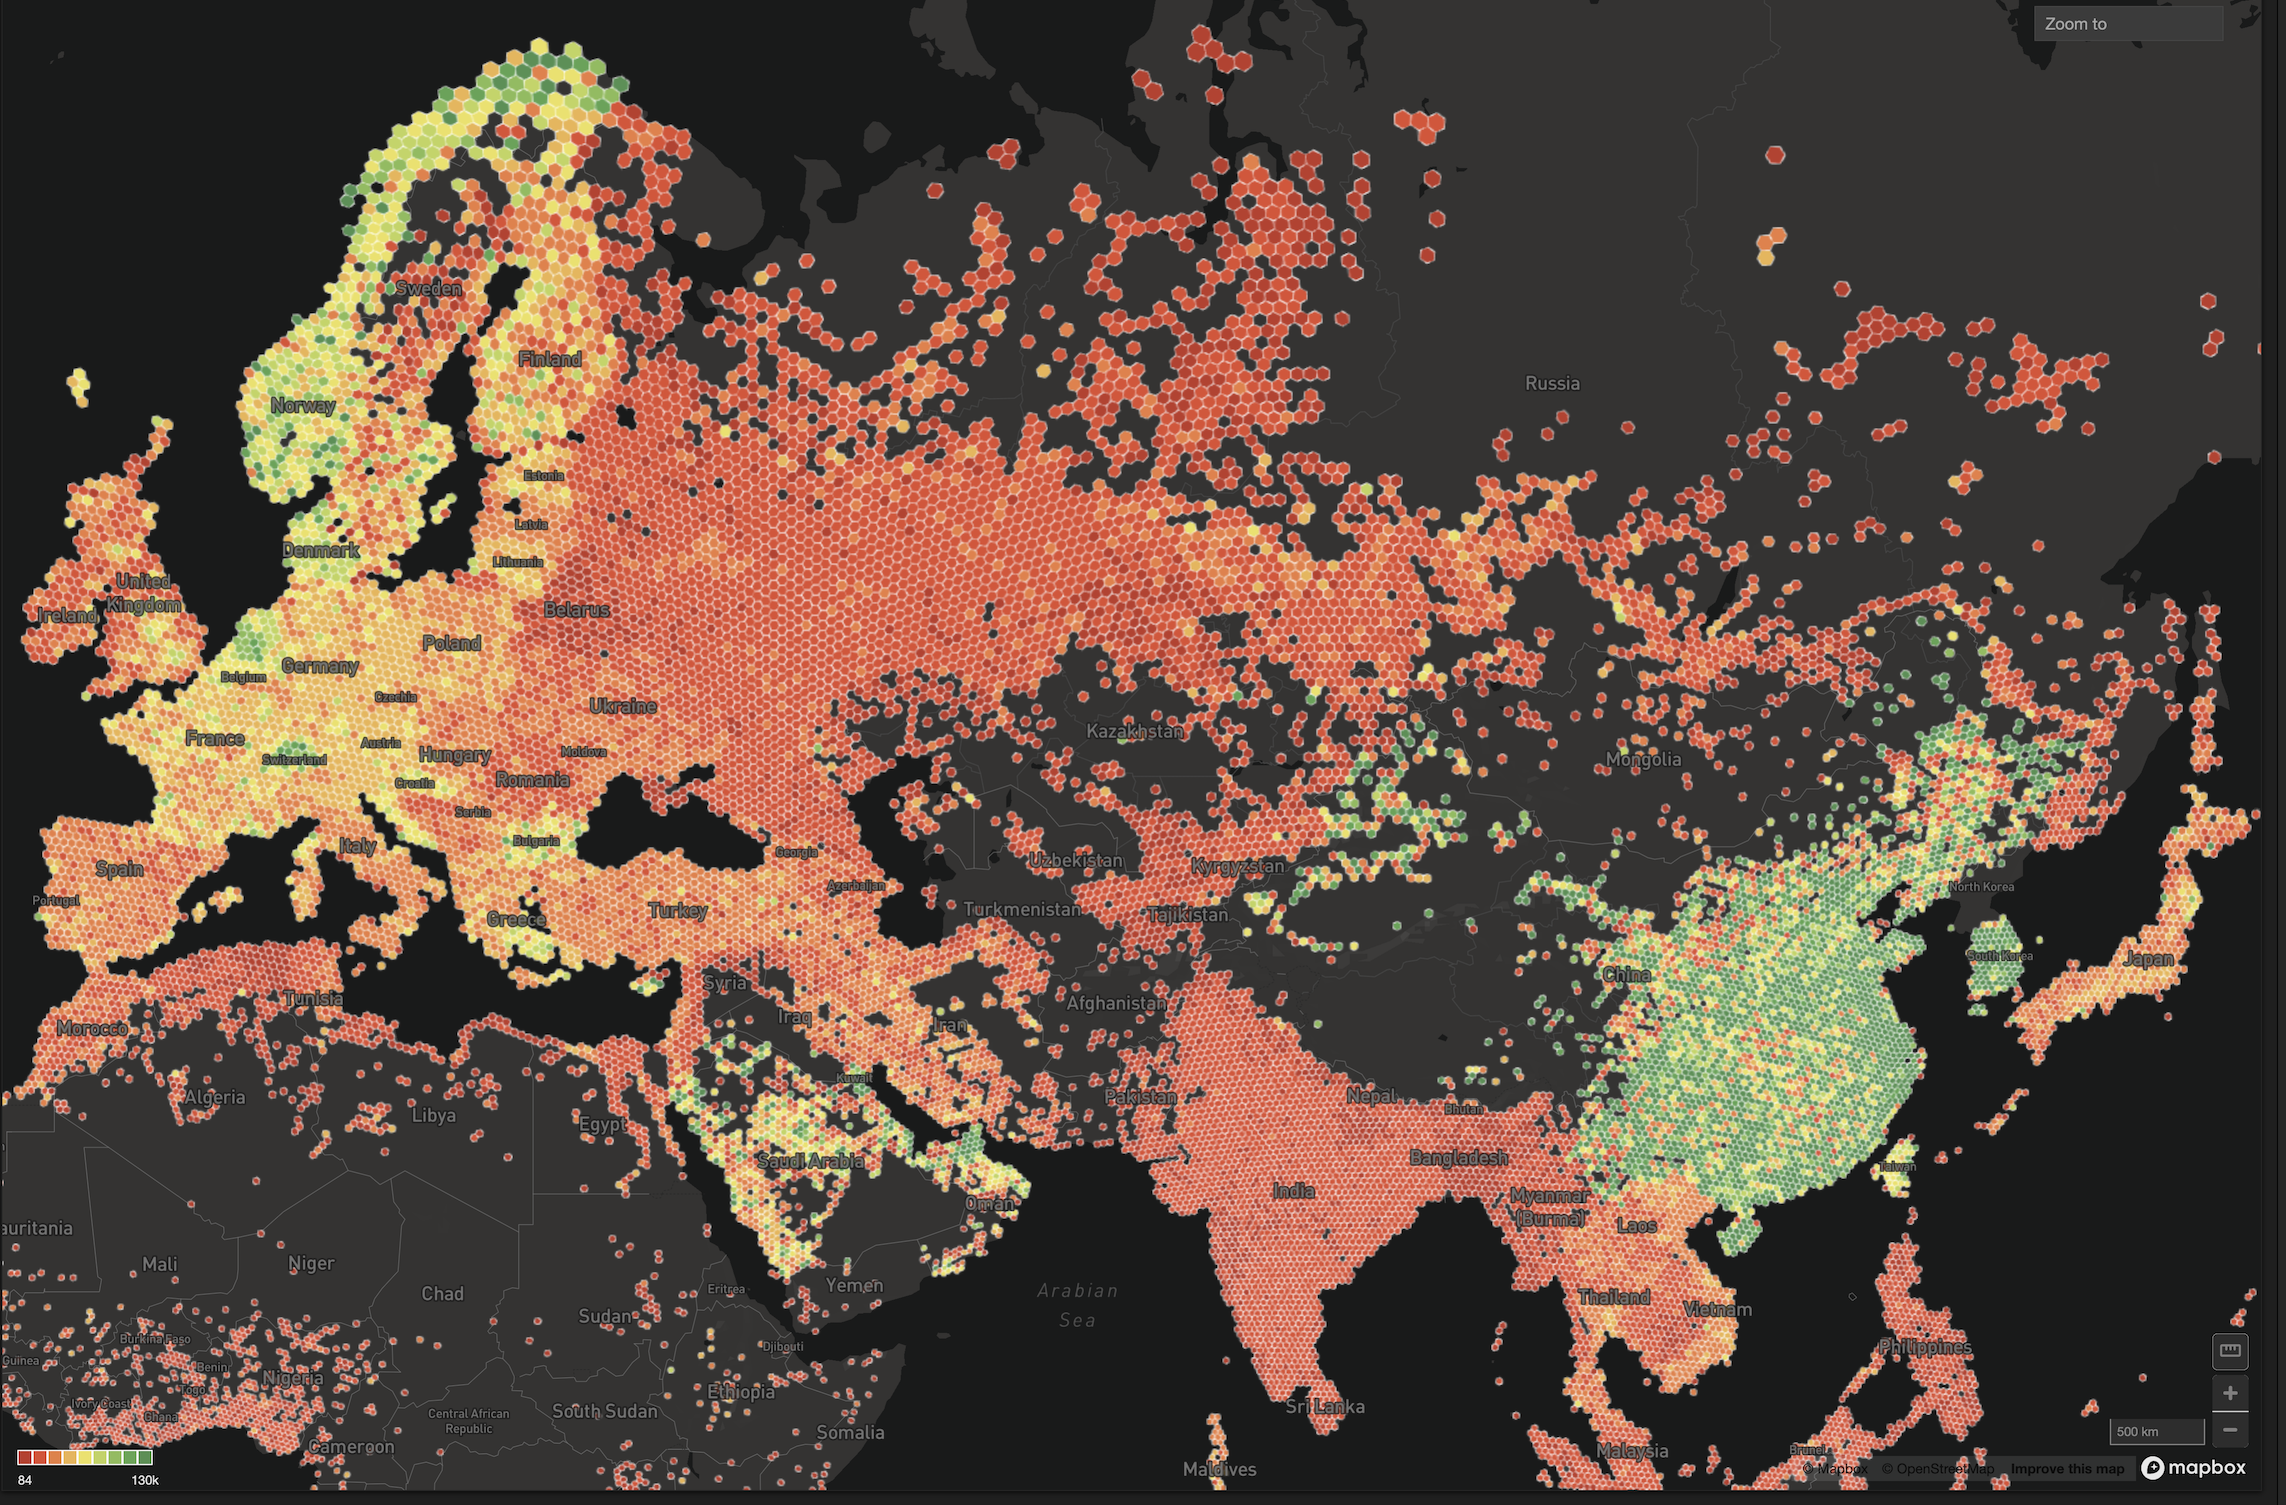
MapD was built from the ground up to enable fully interactive querying and visualization on multi-billion row datasets. An important feature of our system is the ability to visualize large results sets, regardless of their cardinality


